
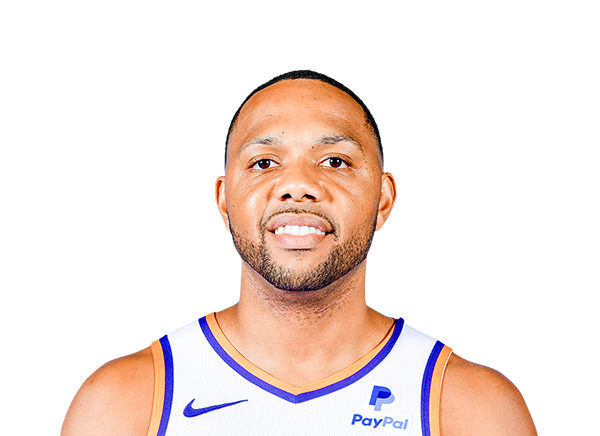
2025-26 Regular Season · NBA PLAYER DOSSIER
BENCH
G
Eric Gordon
Philadelphia 76ers (PHI) · 6 GP (0 GS) · 12.3 MPG · Hollinger GmSc 4.6
POINTS (PPG)
5.5
6 GP (0 GS)
REBOUNDS (RPG)
0.3
Glass load
ASSISTS (APG)
0.5
0.5 TOPG
PTS+REB+AST (PRA)
6.3
Combined output
TRUE SHOOTING (TS%)
75.4%
76.2% eFG%
SHOOTING SPLITS
57.1% / 57.1%
50.0% FT · 1.3 3PM/G
STOCKS (STL / BLK)
0.7 / 0.2
Defensive disruption
HOLLINGER GMSC
4.6
12.3 MPG
Prop Hit-Rate Dossier (L5 · L10 · Season)
Over Hit Frequency vs Baseline Half-Point Line| Prop Market | Line | Season Avg | L5 Hit% | L10 Hit% | Season Hit% |
|---|---|---|---|---|---|
| Points Over PTS | O 5.5 | 5.5 | 40% (2/5) | 50% (3/6) | 50% (3/6) |
| Rebounds Over REB | O 0.5 | 0.3 | 20% (1/5) | 17% (1/6) | 17% (1/6) |
| Assists Over AST | O 0.5 | 0.5 | 40% (2/5) | 33% (2/6) | 33% (2/6) |
| Pts + Reb + Ast Over PRA | O 6.5 | 6.3 | 40% (2/5) | 50% (3/6) | 50% (3/6) |
| 3-Pointers Made Over 3PM | O 1.5 | 1.3 | 40% (2/5) | 50% (3/6) | 50% (3/6) |
Situational & Recency Splits
L5 / L10 Form vs Home & Road Venue Splits| Split Window | GP | MIN | PTS | REB | AST | PRA | 3PM | FG% | 3P% | TS% | GmSc |
|---|---|---|---|---|---|---|---|---|---|---|---|
| Season Average | 6 | 12.3 | 5.5 | 0.3 | 0.5 | 6.3 | 1.3 | 57.1% | 57.1% | 75.4% | 4.6 |
| Last 10 Games (L10) | 6 | 12.3 | 5.5 | 0.3 | 0.5 | 6.3 | 1.3 | 57.1% | 57.1% | 75.4% | 4.6 |
| Last 5 Games (L5) | 5 | 12.6 | 5.0 | 0.4 | 0.6 | 6.0 | 1.2 | 52.9% | 54.5% | 69.9% | 4.2 |
| Home Court Splits | 5 | 13.8 | 6.6 | 0.4 | 0.6 | 7.6 | 1.6 | 57.1% | 57.1% | 75.4% | 5.5 |
| Road Splits | 1 | 5.0 | 0.0 | 0.0 | 0.0 | 0.0 | 0.0 | 0.0% | 0.0% | - | 0.0 |
STARTER · 38.0 MPG
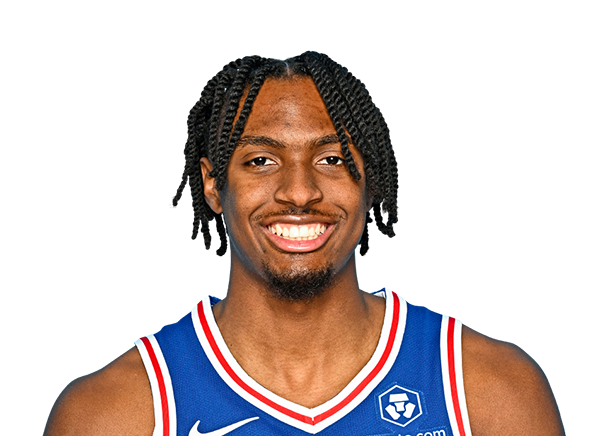 Tyrese Maxey
G
28.3 PPG
4.1 RPG · 6.6 APG · 58.8% TS%
STARTER · 31.5 MPG
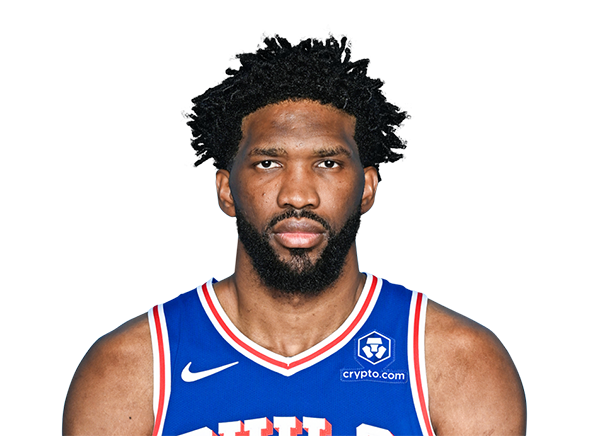 Joel Embiid
C
26.9 PPG
7.7 RPG · 3.9 APG · 60.5% TS%
STARTER · 30.6 MPG
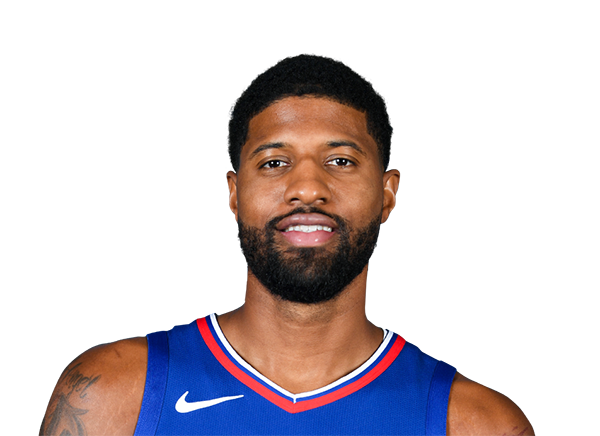 Paul George
F
17.3 PPG
5.3 RPG · 3.6 APG · 57.0% TS%
STARTER · 35.0 MPG
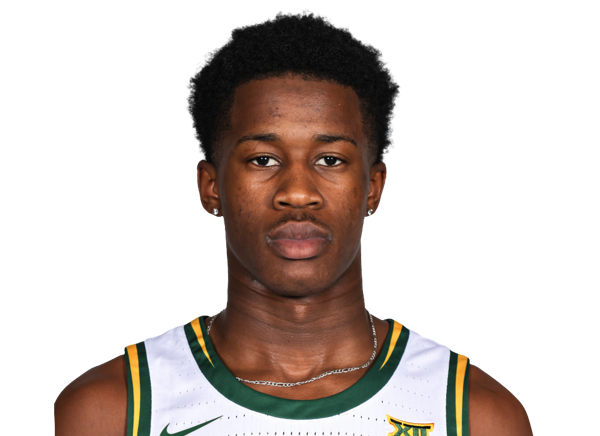 VJ Edgecombe
G
16.0 PPG
5.6 RPG · 4.2 APG · 54.0% TS%
STARTER · 31.5 MPG
 Kelly Oubre Jr.
G
14.1 PPG
5.0 RPG · 1.6 APG · 58.0% TS%
ROTATION · 29.5 MPG
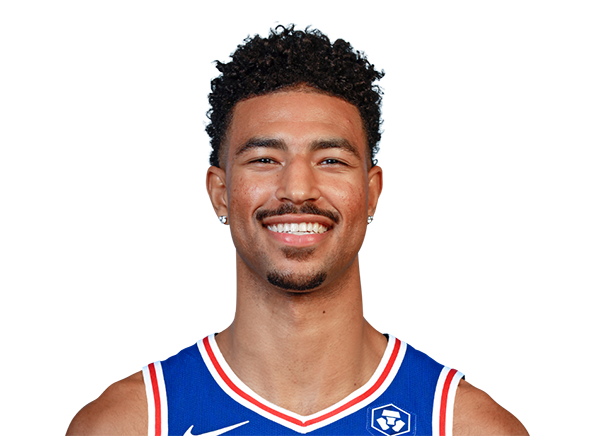 Quentin Grimes
G
13.4 PPG
3.6 RPG · 3.3 APG · 58.5% TS%
STARTER · 23.7 MPG
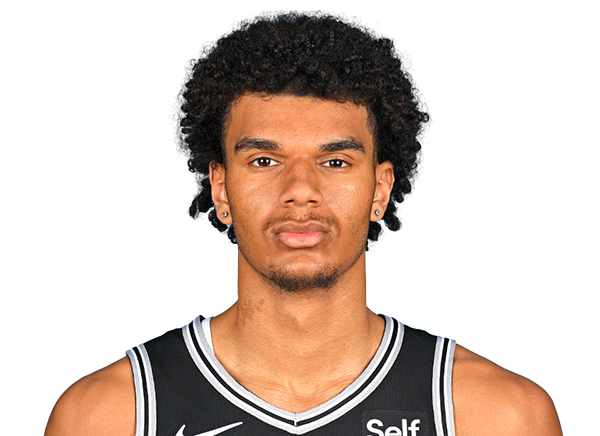 Dominick Barlow
F
7.7 PPG
4.8 RPG · 1.2 APG · 59.7% TS%
ROTATION · 17.0 MPG
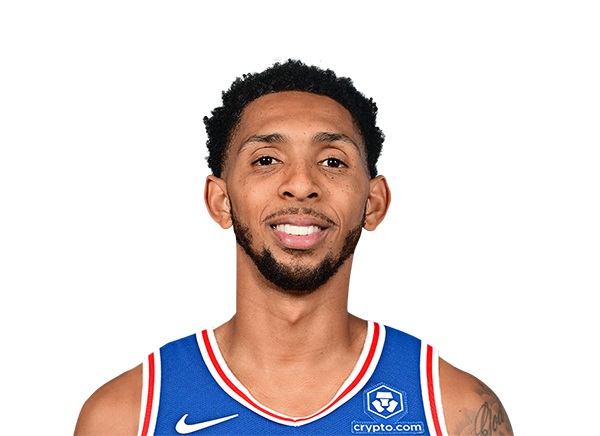 Cameron Payne
PG
7.4 PPG
2.0 RPG · 2.6 APG · 51.4% TS%
Tyrese Maxey
G
Joel Embiid
C
Paul George
F
VJ Edgecombe
G
Kelly Oubre Jr.
G
Quentin Grimes
G
Dominick Barlow
F
Cameron Payne
PG
| Date | Opponent | Result | MIN | PTS | REB | AST | PRA | STL | BLK | TOV | FG | 3PT | FT | GmSc | Box |
|---|---|---|---|---|---|---|---|---|---|---|---|---|---|---|---|
| Dec 23 |
vs
BKN
|
L 106-114 | 17 | 12 | 0 | 0 | 12 | 1 | 1 | 0 | 4-8 | 3-6 | 1-2 | 9.3 | Box |
| Dec 2 |
vs
WSH
|
W 121-102 | 13 | 3 | 0 | 0 | 3 | 0 | 0 | 0 | 1-4 | 1-2 | 0-0 | 0.6 | Box |
| Nov 25 |
vs
ORL
|
L 103-144 | 22 | 10 | 2 | 2 | 14 | 2 | 0 | 1 | 4-4 | 2-2 | 0-0 | 12.2 | Box |
| Nov 9 |
vs
DET
|
L 108-111 | 6 | 0 | 0 | 1 | 1 | 0 | 0 | 1 | 0-1 | 0-1 | 0-0 | -1.0 | Box |
| Oct 28 |
@
WSH
|
W 139-134 | 5 | 0 | 0 | 0 | 0 | 0 | 0 | 0 | 0-0 | 0-0 | 0-0 | 0.0 | Box |
| Oct 27 |
vs
ORL
|
W 136-124 | 11 | 8 | 0 | 0 | 8 | 1 | 0 | 1 | 3-4 | 2-3 | 0-0 | 6.4 | Box |